You want a dashboard of your business numbers, and you don’t want to learn Power BI to get one. An AI dashboard builder makes the charts for you: Claude, ChatGPT, Bricks and Julius build one from a spreadsheet in a couple of minutes, while Copilot in Power BI and Context Board build one on live connections that keeps showing new numbers.
That split decides which tool fits. A dashboard built from a file shows the numbers you handed it, and next week you build it again. A dashboard built on connections, like a Context Board dashboard your agent puts together, keeps up on its own.
Every price in this post was read on the vendor’s own site on November 17, 2026, and the Claude Code build is a test we ran the same day. Context Board is ours, so weigh the bias.
- Fastest, from a file: upload a CSV to Claude or ChatGPT and ask for a dashboard. In our test, Claude Code built a correct five-metric dashboard in 1 minute 44 seconds.
- It won’t update itself: the numbers sit inside the file. We added a week to the CSV and the dashboard stayed the same until we asked Claude again.
- Free to start: Claude’s Free plan makes artifacts, and Bricks Free gives you 20 AI messages a month for dashboards.
- Already on Microsoft: Copilot in Power BI builds report pages from a prompt, but it needs a paid Fabric capacity (about $263 a month for the smallest) on top of Pro at $14 a user.
- Live, and changed by asking: Context Board pulls Stripe, Google Analytics and Search Console while it’s open, and your agent adds the widgets you ask for. $12 a month after 3 free days.
How to build a dashboard with AI
The steps are the same whichever builder you pick. Step 5 is where the tools differ.
-
Pick five numbers. Revenue, paying customers, trials, signups and visitors cover most small businesses. Our KPI dashboard examples give the formula and the source for each.
-
Get the data out. Export a CSV from Stripe, Google Analytics or your spreadsheet, with one row per week and one column per number. Skip this step if your builder connects to those tools directly.
-
Ask for the dashboard in one paragraph. Name the file, the numbers, the comparison and the output you want. This is the prompt from our test:
Build me a dashboard from weekly.csv in this folder: one self-contained HTML file called dashboard.html that I can open in my browser. Show MRR, paid customers, trials, signups and visitors, each with the change since the week before, and a chart of the trend. -
Check two numbers against the source. Compare the latest week and one older week with Stripe or your sheet. A builder that misreads a column shows the wrong number with the same confidence.
-
Decide how next week’s numbers get in. Upload a new file and ask again, let Power BI refresh on a schedule, or connect your tools to a board that pulls them itself.
AI dashboard builders compared
| Builder | How it builds | Where the numbers come from | Stays current? | Price, read Nov 17, 2026 |
|---|---|---|---|---|
| Context Board | Your agent, or the board’s chat, adds widgets when you ask | Stripe, Google Analytics, Search Console, PostHog and more, plus anything your agent sends | Yes, every 30 minutes while the board is open | $12 a month after 3 free days |
| Claude | Writes an interactive artifact in the chat | A file you upload, or apps you connected to Claude | Not from a file | Free; Pro $20 a month ($17 billed yearly) |
| ChatGPT | Data analysis on a file you upload | A file you upload | No | Interactive charts on Plus, $20 a month |
| Copilot in Power BI | Creates report pages from a prompt | Your Power BI data model | Yes, up to 48 scheduled refreshes a day on Fabric capacity | Pro $14 a user a month, plus a Fabric F2 or Premium capacity |
| Bricks | Builds a dashboard from a CSV, Excel or PDF file | Files you upload; advanced connectors on Pro | Not from a file | Free (20 AI messages a month); Premium $25 a month |
| Julius | Reports and dashboards from your data files | Files; Postgres, BigQuery and Snowflake on Business ($450 a month) | Not from a file | Plus $20 a month ($16 billed yearly) for file analysis and charts |
The table splits in two. Claude, ChatGPT, Bricks and Julius are the quick route when you have a file today and need charts for one meeting. Power BI and Context Board take longer to set up, and then the dashboard stays current without another upload.
Power BI’s AI is the expensive route for a small business. Microsoft’s Copilot requirements page says Copilot needs a paid Fabric capacity (F2 or higher) or Power BI Premium, and that a Pro or Premium Per User license alone isn’t enough. Microsoft’s pay-as-you-go rate for Fabric in US East is $0.18 per capacity unit an hour, and F2 has two units, so the smallest capacity costs about $263 a month if it runs all month. The Power BI pricing page lists Pro at $14 a user a month, paid yearly.
Prompt-to-code builders such as InBuild show up in the same searches. They write the screen of an admin dashboard as code, and InBuild’s own page says its output has no charts and no data until you wire up your database. They suit someone building an app, and they won’t show you this week’s revenue.
Can ChatGPT or Claude build a dashboard?
Yes, from a file. We gave Claude Code (version 2.1.325, running Claude Fable 5.2) a CSV of 12 weeks of example numbers and the prompt above, and let it read and write files in that folder.
- Time: 1 minute 44 seconds and 12 turns, for one 11.5 KB HTML file.
- Layout: MRR in a wide card, then four cards with their own trend lines, each with the change since the week before in green or red.
- Extras we didn’t ask for: hovering on any chart shows that week on all five, and a data table folds out at the bottom.
- Accuracy: every latest value and change matched the CSV, such as MRR at $3,040, up $115 or 3.9%.
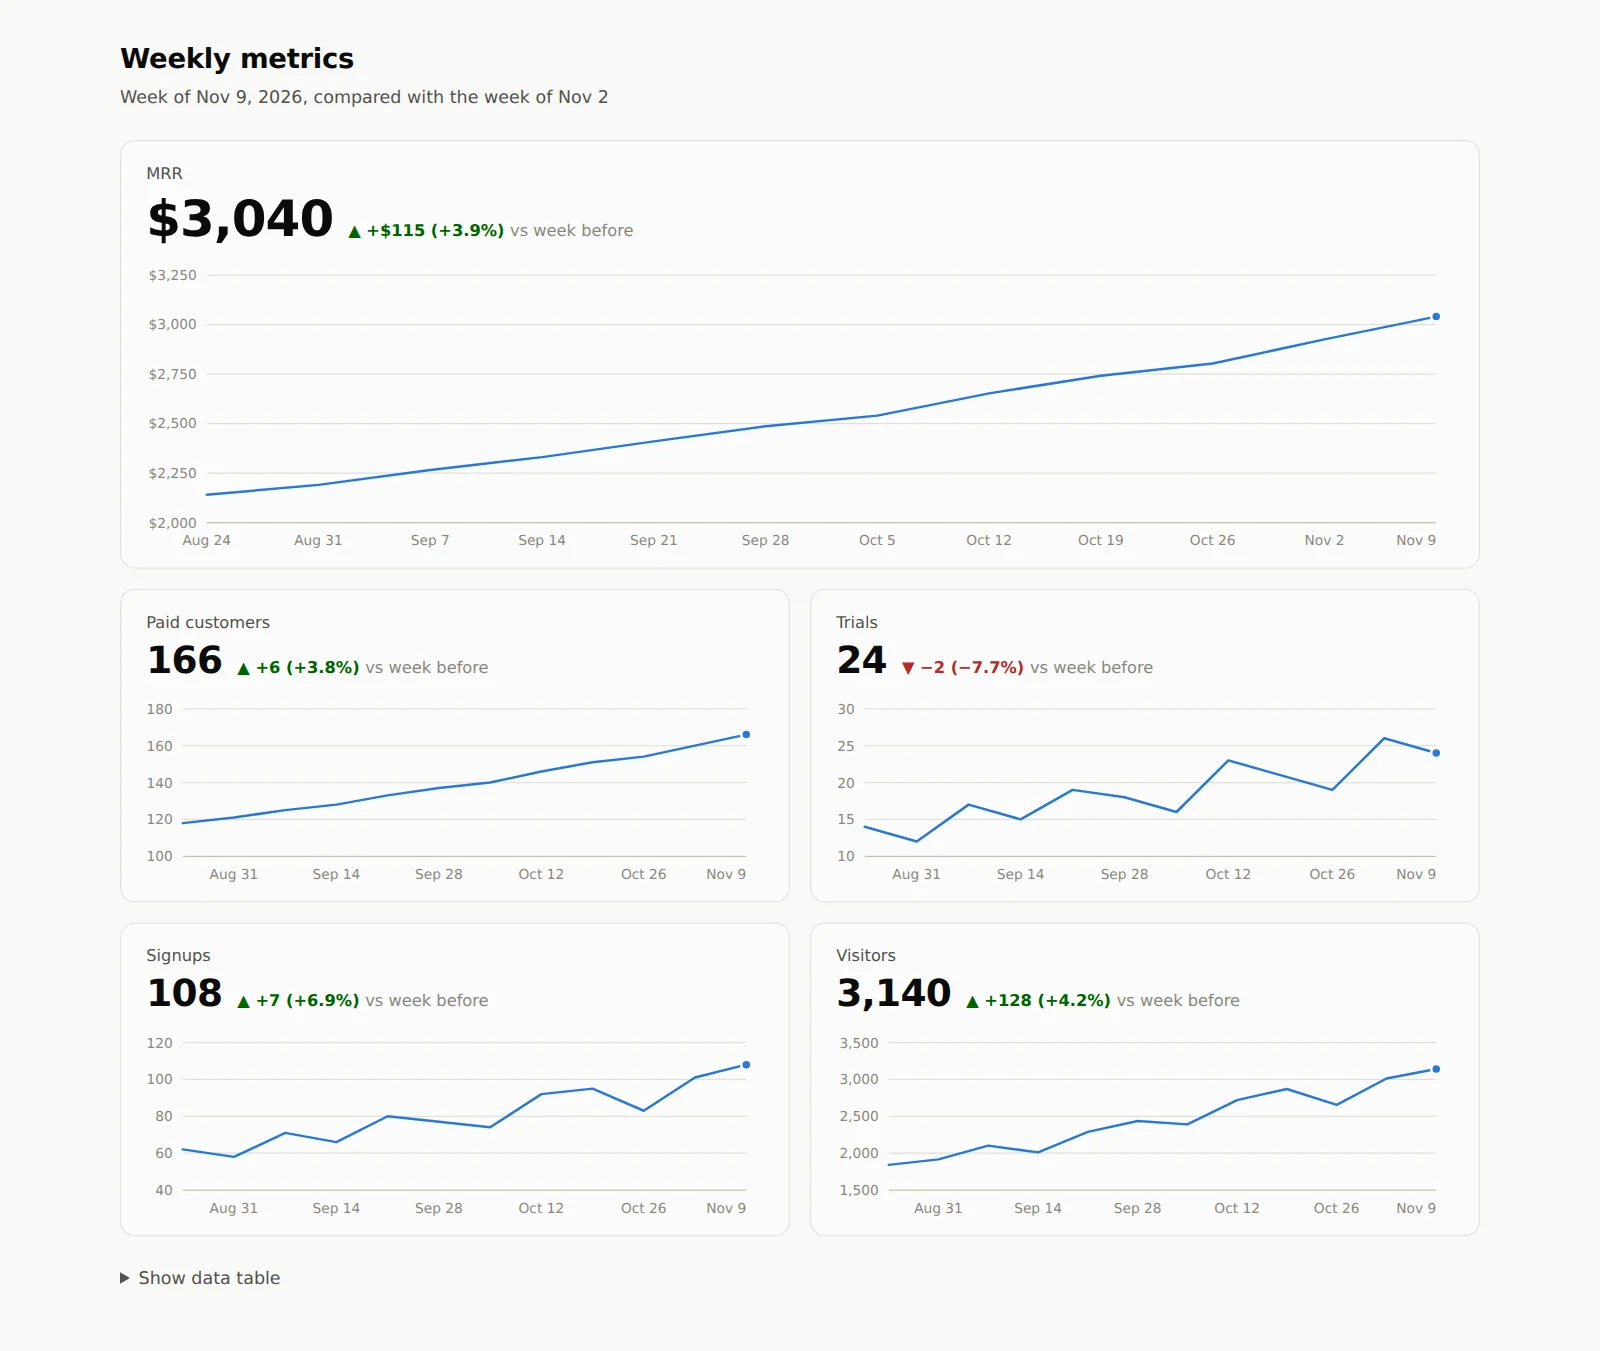
What Claude Code built from 12 weeks of example numbers, opened in Chrome. The rows are pasted inside the page.
Then we added a 13th week to the CSV and reloaded the page. The dashboard didn’t change. Claude had pasted the 12 rows into the HTML under a comment that reads “To refresh the dashboard, replace the rows below.” Asking Claude to update it took 17 seconds. That is quick, but it’s a job you repeat every week, after you export a fresh CSV.
ChatGPT works the same way through data analysis: upload the file and ask. OpenAI’s pricing page lists data analysis on every plan, limited on Free, and interactive tables and charts on Plus and Pro.
Claude has one way around the snapshot. An artifact can read the apps you connected to Claude, so a dashboard built on a connected app can show fresh numbers when you open it. Our guide to Claude Artifacts covers which plans get that and where artifacts stop.
Is there a free AI dashboard generator?
Yes, several, and each stops at a different point:
- Claude Free makes artifacts, with limited usage every 5 hours (Anthropic’s pricing page).
- Bricks Free includes AI dashboards and reports with 20 AI messages a month (Bricks pricing).
- Julius Free comes with a daily credit allowance, but its pricing page lists file analysis and charts from Plus, at $20 a month.
- ChatGPT Free has limited data analysis and no interactive charts.
- Data Studio, which Google renamed from Looker Studio, is free and stays live on Google’s own data, but you drag the charts in yourself.
Copilot in Power BI has no free route: Microsoft says trial capacities and free SKUs aren’t supported. For a one-off chart, any free tier above will do. For a dashboard you open every morning, the bigger cost is the weekly export and rebuild.
Build a dashboard your agent keeps current
A Context Board is a web app at board.contextbolt.com, made by ContextBolt, where your numbers come in from the tools themselves and your agent builds the widgets. The same five-number dashboard takes five steps there:
- Start a board. Sign in at board.contextbolt.com with an email code and pick Founder HQ as your first board: revenue, signups and your agents’ work on one screen.
- Connect your tools once. Click Connect (the plug icon, top right) and sign in to Stripe, Google Analytics or Search Console. Every widget that needs one fills in, and your agents read the same numbers.
- Connect your agent. Add
https://board.contextbolt.com/mcpin Claude, Claude Code, Codex, Cursor or any app that speaks MCP, and click Allow on the board’s page. In Claude Code it is one line:claude mcp add --transport http --scope user context-board https://board.contextbolt.com/mcp. The setup steps for each app are in the docs. - Ask for the widget. Type “Add a chart of trials by week” to your agent or to the board’s own chat. The agent sends the data and adds the chart, and the change carries its name.
- Change it in a sentence. “Swap visitors for top pages” or “put MRR next to the goal” works the same way, and any change undoes in one click.

Context Board’s public demo after asking its chat for a chart of trials by week. Every number is sample data.
Sources refresh every 30 minutes while the board is open, and a widget’s Updated time refreshes it on a click. A failed pull keeps the last good number and says what went wrong. Two limits to know first: sources refresh only while the board is open in front of you, and the board doesn’t email you a weekly report. If a PDF in your inbox every Monday is the job, Power BI or a reporting tool fits better.
To try it, connect Stripe or Google Analytics, connect your agent, and ask for the chart you check most. Start your dashboard board: 3 days free, then $12 a month.